 HTTP(S) Low source port Statistics for www.sput.nl
Program started at Sun-01-Nov-2026 07:28.
Analysed requests from Sun-25-Oct-2026 07:18 to Sun-01-Nov-2026 06:43 (6.98 days).
HTTP(S) Low source port Statistics for www.sput.nlProgram started at Sun-01-Nov-2026 07:28.
Analysed requests from Sun-25-Oct-2026 07:18 to Sun-01-Nov-2026 06:43 (6.98 days).
(Go To: Top | Daily Report | Daily Summary | Hourly Summary | TLD Report | Organisation Report | Host Report | Service Type Report | Protocol Report | Request Report)
Each unit ( ) represents 80 requests or part thereof.
| date | reqs | |
|---|---|---|
| 25/Oct/26 | 1663 |   |
| 26/Oct/26 | 3332 |    |
| 27/Oct/26 | 1460 | |
| 28/Oct/26 | 2101 | |
| 29/Oct/26 | 1295 | |
| 30/Oct/26 | 1207 | |
| 31/Oct/26 | 263 | |
| 1/Nov/26 | 123 | |
Busiest day: 26/Oct/26 (3,332 requests).
(Go To: Top | Daily Report | Daily Summary | Hourly Summary | TLD Report | Organisation Report | Host Report | Service Type Report | Protocol Report | Request Report)
Each unit () represents 80 requests or part thereof.
| day | reqs | |
|---|---|---|
| Sun | 1786 | |
| Mon | 3332 | |
| Tue | 1460 | |
| Wed | 2101 | |
| Thu | 1295 | |
| Fri | 1207 | |
| Sat | 263 | |
(Go To: Top | Daily Report | Daily Summary | Hourly Summary | TLD Report | Organisation Report | Host Report | Service Type Report | Protocol Report | Request Report)
Each unit () represents 30 requests or part thereof.
| hour | reqs | |
|---|---|---|
| 0 | 314 | |
| 1 | 738 | |
| 2 | 975 | |
| 3 | 1391 | |
| 4 | 1148 | |
| 5 | 675 | |
| 6 | 504 | |
| 7 | 565 | |
| 8 | 715 | |
| 9 | 273 | |
| 10 | 193 | |
| 11 | 140 | |
| 12 | 133 | |
| 13 | 319 | |
| 14 | 410 | |
| 15 | 596 | |
| 16 | 287 | |
| 17 | 436 | |
| 18 | 316 | |
| 19 | 335 | |
| 20 | 196 | |
| 21 | 273 | |
| 22 | 213 | |
| 23 | 299 | |
(Go To: Top | Daily Report | Daily Summary | Hourly Summary | TLD Report | Organisation Report | Host Report | Service Type Report | Protocol Report | Request Report)
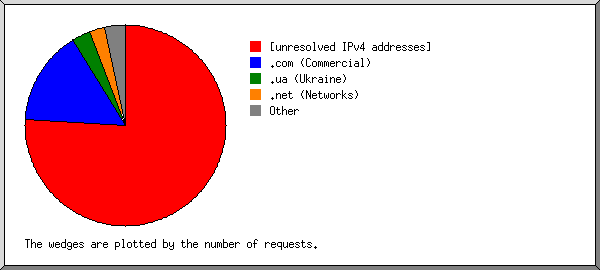
Listing domains, sorted by the number of requests.
| no. | reqs | %reqs | domain |
|---|---|---|---|
| 1 | 6370 | 55.66% | [unresolved IPv4 addresses] |
| 2 | 2501 | 21.85% | .com (Commercial) |
| 3 | 1695 | 14.81% | .net (Networks) |
| 4 | 395 | 3.45% | .de (Germany) |
| 5 | 149 | 1.30% | .au (Australia) |
| 6 | 103 | 0.90% | .jp (Japan) |
| 7 | 56 | 0.49% | .cz (Czech Republic) |
| 8 | 50 | 0.44% | .co (Colombia) |
| 9 | 50 | 0.44% | .eu (European Union) |
| 10 | 22 | 0.19% | .us (United States) |
| 11 | 11 | 0.10% | .be (Belgium) |
| 12 | 11 | 0.10% | .gg (Guernsey) |
| 13 | 9 | 0.08% | .ar (Argentina) |
| 14 | 8 | 0.07% | .cloud (Cloud) |
| 15 | 6 | 0.05% | [unknown domain] |
| 16 | 6 | 0.05% | .es (Spain) |
| 17 | 2 | 0.02% | .io (British Indian Ocean Territory) |
(Go To: Top | Daily Report | Daily Summary | Hourly Summary | TLD Report | Organisation Report | Host Report | Service Type Report | Protocol Report | Request Report)
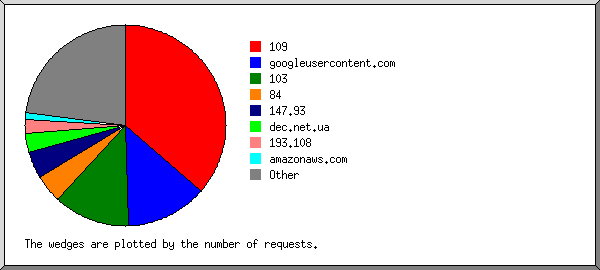
Listing the top 30 organisations by the number of requests, sorted by the number of requests.
| no. | reqs | %reqs | organisation |
|---|---|---|---|
| 1 | 2587 | 22.61% | 180.93 |
| 2 | 926 | 8.09% | idcloudhost.com |
| 3 | 469 | 4.10% | myshopify.com |
| 4 | 301 | 2.63% | 216.198 |
| 5 | 291 | 2.54% | secureserver.net |
| 6 | 269 | 2.35% | 94 |
| 7 | 258 | 2.25% | amazonaws.com |
| 8 | 255 | 2.23% | 69 |
| 9 | 254 | 2.22% | 185.8 |
| 10 | 254 | 2.22% | hostyourservices.net |
| 11 | 254 | 2.22% | globehosting.net |
| 12 | 254 | 2.22% | 192.250 |
| 13 | 253 | 2.21% | bitrace.net |
| 14 | 238 | 2.08% | your-server.de |
| 15 | 232 | 2.03% | 104 |
| 16 | 216 | 1.89% | render.com |
| 17 | 180 | 1.57% | 5 |
| 18 | 177 | 1.55% | ovh.net |
| 19 | 171 | 1.49% | cyon.net |
| 20 | 157 | 1.37% | de-nserver.de |
| 21 | 152 | 1.33% | ui-r.com |
| 22 | 149 | 1.30% | nerdnetwork.net.au |
| 23 | 146 | 1.28% | 110 |
| 24 | 144 | 1.26% | 141.193 |
| 25 | 129 | 1.13% | servconfig.com |
| 26 | 118 | 1.03% | a1center.net |
| 27 | 115 | 1.00% | a2hosting.com |
| 28 | 111 | 0.97% | 170.10 |
| 29 | 104 | 0.91% | webhostsg.com |
| 30 | 103 | 0.90% | secure.ne.jp |
| 2177 | 19.02% | [not listed: 94 organisations] |
(Go To: Top | Daily Report | Daily Summary | Hourly Summary | TLD Report | Organisation Report | Host Report | Service Type Report | Protocol Report | Request Report)
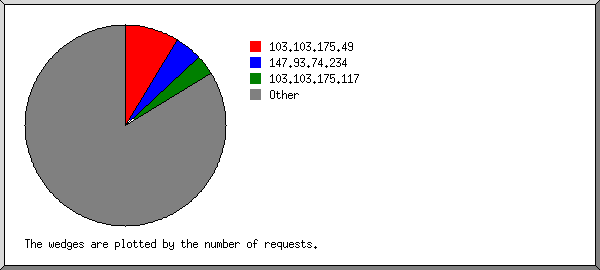
Listing the top 30 hosts by the number of requests, sorted by the number of requests.
| no. | reqs | %reqs | host |
|---|---|---|---|
| 1 | 2587 | 22.61% | 180.93.150.96 |
| 2 | 926 | 8.09% | iix1538.idcloudhost.com |
| 3 | 469 | 4.10% | shops.myshopify.com |
| 4 | 298 | 2.60% | 216.198.79.65 |
| 5 | 255 | 2.23% | 94.23.64.18 |
| 6 | 255 | 2.23% | 69.174.52.66 |
| 7 | 254 | 2.22% | cpanel-03-buc.globehosting.net |
| 8 | 254 | 2.22% | 192.250.227.238 |
| 9 | 254 | 2.22% | syn331.syd2.hostyourservices.net |
| 10 | 254 | 2.22% | 185.8.237.5 |
| 11 | 253 | 2.21% | brweb5.bitrace.net |
| 12 | 246 | 2.15% | ec2-3-230-194-247.compute-1.amazonaws.com |
| 13 | 226 | 1.97% | www146.your-server.de |
| 14 | 216 | 1.89% | ip-216-24-57-16.ingress.render.com |
| 15 | 171 | 1.49% | s114.cyon.net |
| 16 | 157 | 1.37% | cloud8-vm488.de-nserver.de |
| 17 | 156 | 1.36% | 134.119.180.107.host.secureserver.net |
| 18 | 155 | 1.35% | 5.45.196.116 |
| 19 | 152 | 1.33% | 217-160-0-235.elastic-ssl.ui-r.com |
| 20 | 149 | 1.30% | nix1.nerdnetwork.net.au |
| 21 | 146 | 1.28% | 110.78.76.101 |
| 22 | 144 | 1.26% | 141.193.213.11 |
| 23 | 135 | 1.18% | 243.248.12.198.host.secureserver.net |
| 24 | 131 | 1.14% | cluster100.hosting.ovh.net |
| 25 | 129 | 1.13% | vps56001.servconfig.com |
| 26 | 118 | 1.03% | r6.a1center.net |
| 27 | 115 | 1.00% | az1-ts114.a2hosting.com |
| 28 | 111 | 0.97% | 170.10.164.110 |
| 29 | 104 | 0.91% | web105.webhostsg.com |
| 30 | 103 | 0.90% | stuxvd97.secure.ne.jp |
| 2521 | 22.03% | [not listed: 180 hosts] |
(Go To: Top | Daily Report | Daily Summary | Hourly Summary | TLD Report | Organisation Report | Host Report | Service Type Report | Protocol Report | Request Report)
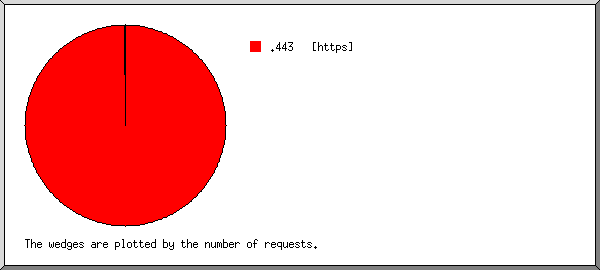
Listing services, sorted by the number of requests.
| no. | reqs | %reqs | service |
|---|---|---|---|
| 1 | 11443 | 99.99% | .443 [https] |
| 2 | 1 | 0.01% | .80 [www] |
(Go To: Top | Daily Report | Daily Summary | Hourly Summary | TLD Report | Organisation Report | Host Report | Service Type Report | Protocol Report | Request Report)
Listing protocols, sorted by the number of requests.
| no. | reqs | %reqs | protocol |
|---|---|---|---|
| 1 | 11444 | 100% | /tcp/ |
(Go To: Top | Daily Report | Daily Summary | Hourly Summary | TLD Report | Organisation Report | Host Report | Service Type Report | Protocol Report | Request Report)
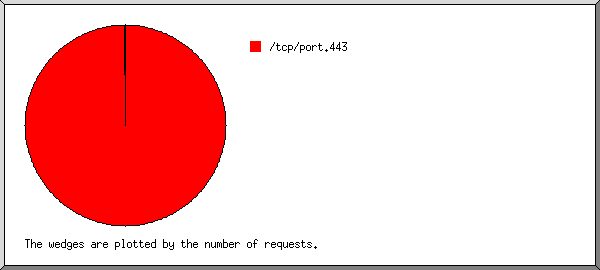
Listing services, sorted by the number of requests.
| no. | reqs | %reqs | service |
|---|---|---|---|
| 1 | 11443 | 99.99% | /tcp/port.443 |
| 2 | 1 | 0.01% | /tcp/port.80 |