 Firewall Statistics for sput.nl
Program started at Sat-05-Jul-2025 07:48.
Analysed requests from Sat-28-Jun-2025 06:59 to Sat-05-Jul-2025 06:46 (6.99 days).
Firewall Statistics for sput.nlProgram started at Sat-05-Jul-2025 07:48.
Analysed requests from Sat-28-Jun-2025 06:59 to Sat-05-Jul-2025 06:46 (6.99 days).
(Go To: Top | Daily Report | Daily Summary | Hourly Summary | TLD Report | Organisation Report | Host Report | Service Type Report | Protocol Report | Request Report)
Each unit ( ) represents 600 requests or part thereof.
| date | reqs | |
|---|---|---|
| 28/Jun/25 | 8801 |    |
| 29/Jun/25 | 12418 |  |
| 30/Jun/25 | 14636 | |
| 1/Jul/25 | 15640 | |
| 2/Jul/25 | 18392 | |
| 3/Jul/25 | 24293 |  |
| 4/Jul/25 | 22513 | |
| 5/Jul/25 | 6305 | |
Busiest day: 3/Jul/25 (24,293 requests).
(Go To: Top | Daily Report | Daily Summary | Hourly Summary | TLD Report | Organisation Report | Host Report | Service Type Report | Protocol Report | Request Report)
Each unit () represents 500 requests or part thereof.
| day | reqs | |
|---|---|---|
| Sun | 12418 | |
| Mon | 14636 | |
| Tue | 15640 | |
| Wed | 18392 | |
| Thu | 24293 | |
| Fri | 22513 | |
| Sat | 15106 | |
(Go To: Top | Daily Report | Daily Summary | Hourly Summary | TLD Report | Organisation Report | Host Report | Service Type Report | Protocol Report | Request Report)
Each unit () represents 200 requests or part thereof.
| hour | reqs | |
|---|---|---|
| 0 | 4219 | |
| 1 | 4348 | |
| 2 | 5091 | |
| 3 | 4976 | |
| 4 | 5074 | |
| 5 | 5344 | |
| 6 | 4858 | |
| 7 | 4442 | |
| 8 | 5600 | |
| 9 | 4471 | |
| 10 | 4348 | |
| 11 | 4320 | |
| 12 | 4491 | |
| 13 | 4777 | |
| 14 | 4870 | |
| 15 | 4861 | |
| 16 | 6592 | |
| 17 | 8359 | |
| 18 | 4681 | |
| 19 | 4393 | |
| 20 | 4377 | |
| 21 | 7899 | |
| 22 | 4250 | |
| 23 | 6357 | |
(Go To: Top | Daily Report | Daily Summary | Hourly Summary | TLD Report | Organisation Report | Host Report | Service Type Report | Protocol Report | Request Report)
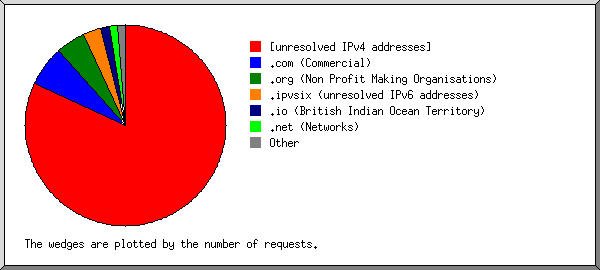
Listing the top 30 domains by the number of requests, sorted by the number of requests.
| no. | reqs | %reqs | domain |
|---|---|---|---|
| 1 | 78653 | 63.95% | [unresolved IPv4 addresses] |
| 2 | 16909 | 13.75% | .com (Commercial) |
| 3 | 11409 | 9.28% | .org (Non Profit Making Organisations) |
| 4 | 7908 | 6.43% | .ipvsix (unresolved IPv6 addresses) |
| 3263 | 2.65% | 2001 | |
| 5 | 3621 | 2.94% | .net (Networks) |
| 6 | 3433 | 2.79% | .io (British Indian Ocean Territory) |
| 7 | 307 | 0.25% | .edu (USA Higher Education) |
| 8 | 144 | 0.12% | .de (Germany) |
| 9 | 122 | 0.10% | .ninja (Ninja) |
| 10 | 104 | 0.08% | .run (Run) |
| 11 | 83 | 0.07% | .eu (European Union) |
| 12 | 47 | 0.04% | .ai (Anguilla) |
| 13 | 33 | 0.03% | .jp (Japan) |
| 14 | 21 | 0.02% | .br (Brazil) |
| 15 | 18 | 0.01% | .uy (Uruguay) |
| 16 | 18 | 0.01% | .th (Thailand) |
| 17 | 18 | 0.01% | .ru (Russia) |
| 18 | 15 | 0.01% | .cloud (Cloud) |
| 19 | 15 | 0.01% | .it (Italy) |
| 20 | 12 | 0.01% | [unknown domain] |
| 21 | 9 | 0.01% | .pl (Poland) |
| 22 | 9 | 0.01% | .se (Sweden) |
| 23 | 8 | 0.01% | .nl (Netherlands) |
| 24 | 8 | 0.01% | .ae (United Arab Emirates) |
| 25 | 5 | .uz (Uzbekistan) | |
| 26 | 5 | .cn (China) | |
| 27 | 5 | .au (Australia) | |
| 28 | 5 | .es (Spain) | |
| 29 | 4 | .tf (French Southern Territories) | |
| 30 | 4 | .ca (Canada) | |
| 46 | 0.04% | [not listed: 27 domains] |
(Go To: Top | Daily Report | Daily Summary | Hourly Summary | TLD Report | Organisation Report | Host Report | Service Type Report | Protocol Report | Request Report)
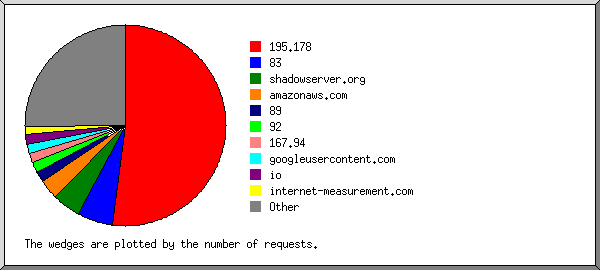
Listing the top 30 organisations by the number of requests, sorted by the number of requests.
| no. | reqs | %reqs | organisation |
|---|---|---|---|
| 1 | 28890 | 23.49% | 89 |
| 2 | 12305 | 10.00% | 45 |
| 3 | 11177 | 9.09% | shadowserver.org |
| 4 | 6280 | 5.11% | amazonaws.com |
| 5 | 4213 | 3.43% | googleusercontent.com |
| 6 | 3576 | 2.91% | 167.94 |
| 7 | 3433 | 2.79% | io |
| 8 | 3227 | 2.62% | internet-measurement.com |
| 9 | 3135 | 2.55% | 83 |
| 10 | 3023 | 2.46% | 2001:0470 |
| 2932 | 2.38% | 2001:0470:02cc | |
| 11 | 2821 | 2.29% | 2604:a880 |
| 2812 | 2.29% | 2604:a880:0400 | |
| 12 | 2646 | 2.15% | onyphe.net |
| 13 | 2639 | 2.15% | stretchoid.com |
| 14 | 2333 | 1.90% | 85 |
| 15 | 2179 | 1.77% | 147.185 |
| 16 | 1354 | 1.10% | 196.251 |
| 17 | 1138 | 0.93% | 198.235 |
| 18 | 1126 | 0.92% | 206.168 |
| 19 | 1094 | 0.89% | 162.142 |
| 20 | 1062 | 0.86% | 205.210 |
| 21 | 903 | 0.73% | 103 |
| 22 | 839 | 0.68% | 204.76 |
| 23 | 756 | 0.61% | 199.45 |
| 24 | 672 | 0.55% | 47 |
| 25 | 646 | 0.53% | 185.218 |
| 26 | 602 | 0.49% | 185.242 |
| 27 | 588 | 0.48% | 176.65 |
| 28 | 574 | 0.47% | 91 |
| 29 | 516 | 0.42% | deepfield.net |
| 30 | 488 | 0.40% | 87 |
| 18763 | 15.25% | [not listed: 1,156 organisations] |
(Go To: Top | Daily Report | Daily Summary | Hourly Summary | TLD Report | Organisation Report | Host Report | Service Type Report | Protocol Report | Request Report)
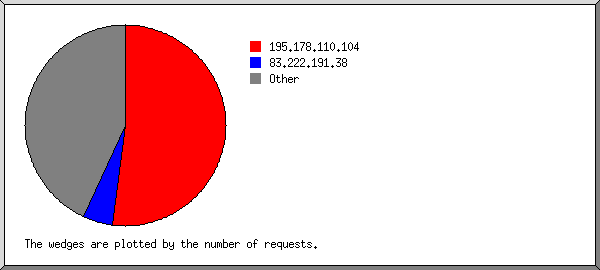
Listing the top 30 hosts by the number of requests, sorted by the number of requests.
| no. | reqs | %reqs | host |
|---|---|---|---|
| 1 | 6462 | 5.25% | 89.248.165.199 |
| 2 | 6347 | 5.16% | 89.248.165.197 |
| 3 | 6328 | 5.14% | 45.142.193.242 |
| 4 | 6025 | 4.90% | 89.248.165.117 |
| 5 | 4725 | 3.84% | 45.142.193.244 |
| 6 | 4008 | 3.26% | 89.248.165.102 |
| 7 | 4008 | 3.26% | 89.248.165.96 |
| 8 | 2307 | 1.88% | 85.187.1.72 |
| 9 | 1039 | 0.84% | 89.248.163.55 |
| 10 | 1027 | 0.83% | ec2-18-189-28-87.us-east-2.compute.amazonaws.com |
| 11 | 1025 | 0.83% | ec2-18-219-56-153.us-east-2.compute.amazonaws.com |
| 12 | 1021 | 0.83% | ec2-18-191-173-38.us-east-2.compute.amazonaws.com |
| 13 | 1014 | 0.82% | ec2-18-119-13-69.us-east-2.compute.amazonaws.com |
| 14 | 1010 | 0.82% | ec2-3-23-104-96.us-east-2.compute.amazonaws.com |
| 15 | 981 | 0.80% | ec2-18-191-69-170.us-east-2.compute.amazonaws.com |
| 16 | 502 | 0.41% | b6.scanner.modat.io |
| 17 | 486 | 0.40% | b3.scanner.modat.io |
| 18 | 477 | 0.39% | b1.scanner.modat.io |
| 19 | 472 | 0.38% | b2.scanner.modat.io |
| 20 | 459 | 0.37% | b5.scanner.modat.io |
| 21 | 354 | 0.29% | 240e:00c2:1800:0084:0000:0001:0003:0002 |
| 22 | 353 | 0.29% | 115.231.78.14 |
| 23 | 342 | 0.28% | 83.222.191.150 |
| 24 | 342 | 0.28% | 103.102.230.4 |
| 25 | 338 | 0.27% | 89.248.163.193 |
| 26 | 337 | 0.27% | 43.129.219.189 |
| 27 | 312 | 0.25% | 204.76.203.206 |
| 28 | 306 | 0.25% | death.ocf.berkeley.edu |
| 29 | 273 | 0.22% | nvm2.scanner.modat.io |
| 30 | 265 | 0.22% | nvm3.scanner.modat.io |
| 70053 | 56.95% | [not listed: 13,725 hosts] |
(Go To: Top | Daily Report | Daily Summary | Hourly Summary | TLD Report | Organisation Report | Host Report | Service Type Report | Protocol Report | Request Report)
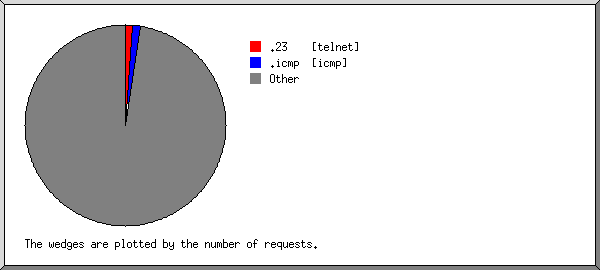
Listing the top 30 services by the number of requests, sorted by the number of requests.
| no. | reqs | %reqs | service |
|---|---|---|---|
| 1 | 4589 | 3.73% | .23 [telnet] |
| 2 | 1489 | 1.21% | .22 [ssh] |
| 3 | 1349 | 1.10% | .icmp [icmp] |
| 4 | 1038 | 0.84% | .8080 [webcache] |
| 5 | 729 | 0.59% | .3389 [ms-wbt-server] |
| 6 | 722 | 0.59% | .8728 [mikrotik] |
| 7 | 656 | 0.53% | .81 [hosts2-ns] |
| 8 | 565 | 0.46% | .2222 [ethernet-ip-io] |
| 9 | 550 | 0.45% | .5900 [vnc] |
| 10 | 528 | 0.43% | .6379 [redis] |
| 11 | 490 | 0.40% | .8081 [blackice-logon] |
| 12 | 480 | 0.39% | .8888 [ddi-tcp-1] |
| 13 | 474 | 0.39% | .445 [microsoft-ds] |
| 14 | 464 | 0.38% | .2323 [3d-nfsd] |
| 15 | 459 | 0.37% | .8443 [prism-http] |
| 16 | 427 | 0.35% | .8000 [irdmi] |
| 17 | 415 | 0.34% | .3306 [mysql] |
| 18 | 414 | 0.34% | .5555 [rplay] |
| 19 | 397 | 0.32% | .8090 [opsmess] |
| 20 | 391 | 0.32% | .82 [xfer] |
| 21 | 389 | 0.32% | .8001 [vcom-tunnel] |
| 22 | 388 | 0.32% | .8088 [omniorb] |
| 23 | 375 | 0.30% | .5060 [sip] |
| 24 | 366 | 0.30% | .9200 [wsp] |
| 25 | 350 | 0.28% | .9000 [cslistener] |
| 26 | 335 | 0.27% | .161 [snmp] |
| 27 | 335 | 0.27% | .5432 [postgresql] |
| 28 | 334 | 0.27% | .83 [mit-ml-dev] |
| 29 | 329 | 0.27% | .1080 [socks] |
| 30 | 327 | 0.27% | .3128 [wwwproxy] |
| 102844 | 83.61% | [not listed: 41,991 services] |
(Go To: Top | Daily Report | Daily Summary | Hourly Summary | TLD Report | Organisation Report | Host Report | Service Type Report | Protocol Report | Request Report)
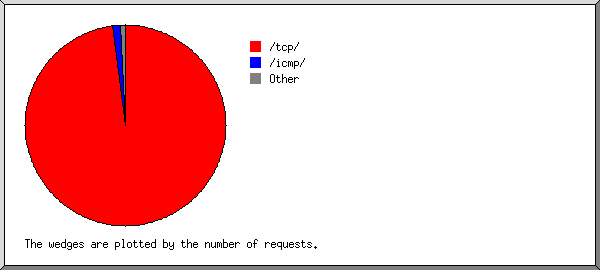
Listing protocols, sorted by the number of requests.
| no. | reqs | %reqs | protocol |
|---|---|---|---|
| 1 | 120204 | 97.73% | /tcp/ |
| 2 | 1426 | 1.16% | /udp/ |
| 3 | 1349 | 1.10% | /icmp/ |
| 4 | 7 | 0.01% | /ipv6/ |
| 5 | 6 | /ip-encap/ | |
| 6 | 6 | /gre/ |
(Go To: Top | Daily Report | Daily Summary | Hourly Summary | TLD Report | Organisation Report | Host Report | Service Type Report | Protocol Report | Request Report)
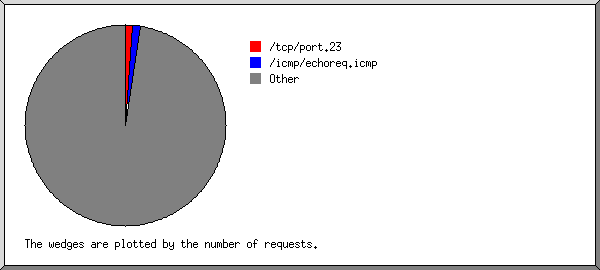
Listing the top 30 services by the number of requests, sorted by the number of requests.
| no. | reqs | %reqs | service |
|---|---|---|---|
| 1 | 4587 | 3.73% | /tcp/port.23 |
| 2 | 1486 | 1.21% | /tcp/port.22 |
| 3 | 1109 | 0.90% | /icmp/echoreq.icmp |
| 4 | 1038 | 0.84% | /tcp/port.8080 |
| 5 | 729 | 0.59% | /tcp/port.3389 |
| 6 | 722 | 0.59% | /tcp/port.8728 |
| 7 | 653 | 0.53% | /tcp/port.81 |
| 8 | 565 | 0.46% | /tcp/port.2222 |
| 9 | 550 | 0.45% | /tcp/port.5900 |
| 10 | 528 | 0.43% | /tcp/port.6379 |
| 11 | 490 | 0.40% | /tcp/port.8081 |
| 12 | 480 | 0.39% | /tcp/port.8888 |
| 13 | 473 | 0.38% | /tcp/port.445 |
| 14 | 464 | 0.38% | /tcp/port.2323 |
| 15 | 459 | 0.37% | /tcp/port.8443 |
| 16 | 427 | 0.35% | /tcp/port.8000 |
| 17 | 414 | 0.34% | /tcp/port.3306 |
| 18 | 414 | 0.34% | /tcp/port.5555 |
| 19 | 397 | 0.32% | /tcp/port.8090 |
| 20 | 391 | 0.32% | /tcp/port.82 |
| 21 | 389 | 0.32% | /tcp/port.8001 |
| 22 | 388 | 0.32% | /tcp/port.8088 |
| 23 | 366 | 0.30% | /tcp/port.9200 |
| 24 | 350 | 0.28% | /tcp/port.9000 |
| 25 | 335 | 0.27% | /tcp/port.5432 |
| 26 | 334 | 0.27% | /tcp/port.83 |
| 27 | 329 | 0.27% | /tcp/port.1080 |
| 28 | 327 | 0.27% | /tcp/port.3128 |
| 29 | 311 | 0.25% | /tcp/port.50 |
| 30 | 310 | 0.25% | /tcp/port.993 |
| 103183 | 83.89% | [not listed: 42,056 services] |