Site map  

Percentage of IPv6 requests

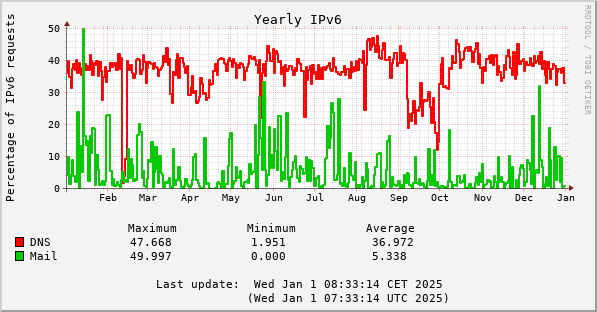
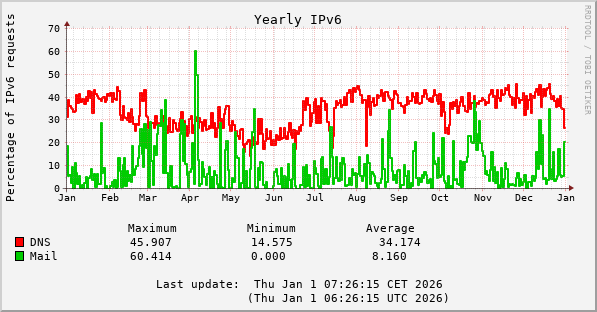
After logfile rotation (ca 06:30 local time), the percentage of IPv6 requests is calculated;


      IPv6 source addresses
  ------------------------------ x 100 %
   IPv4 + IPv6 source addresses

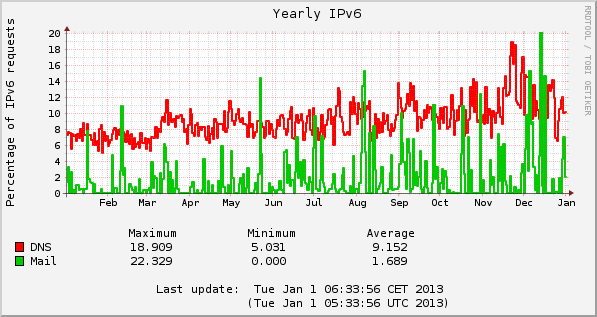
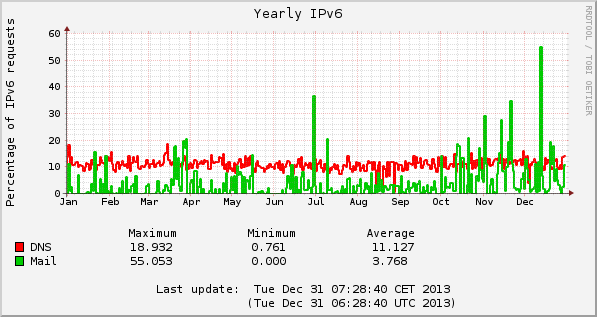
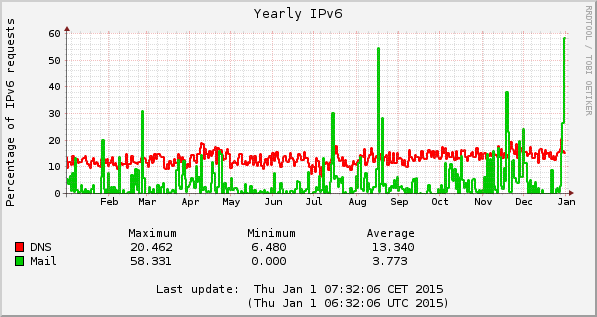
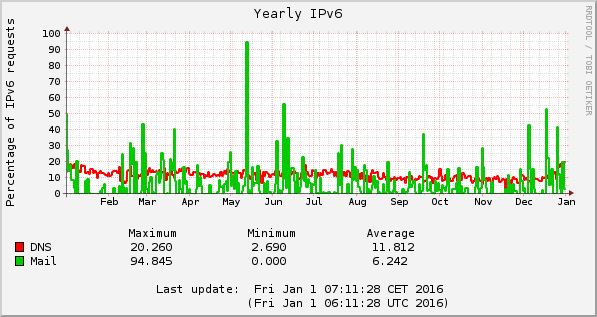
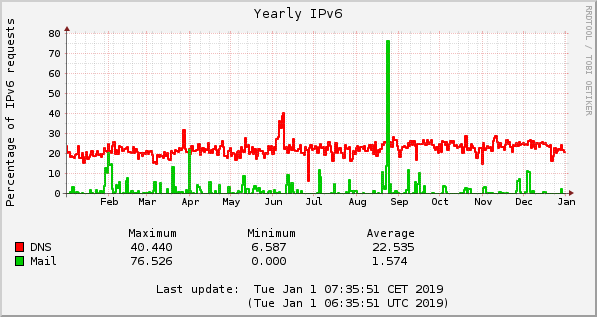
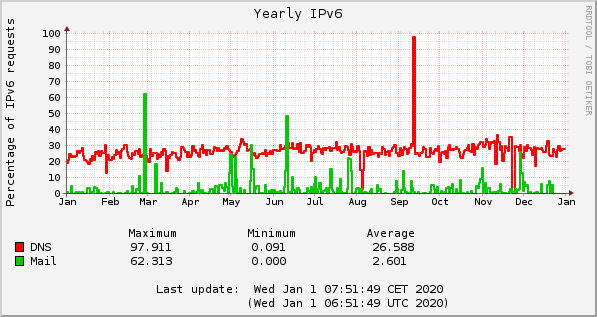
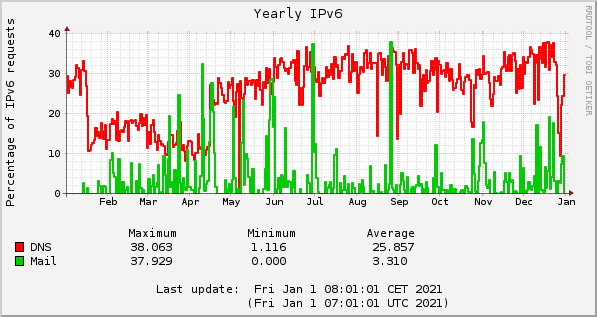
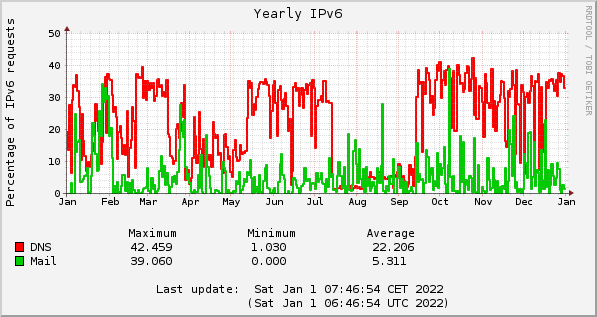
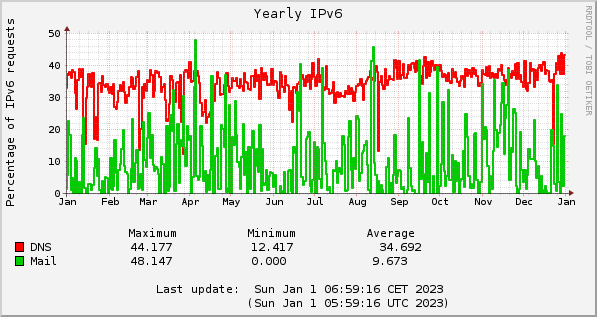
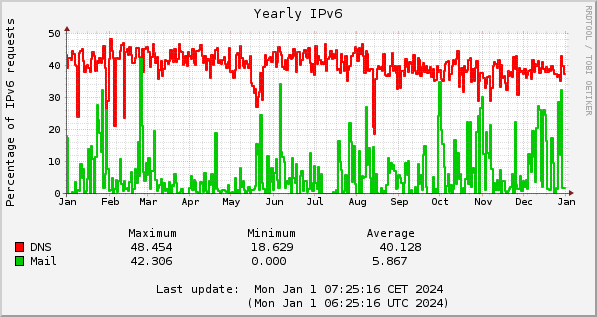
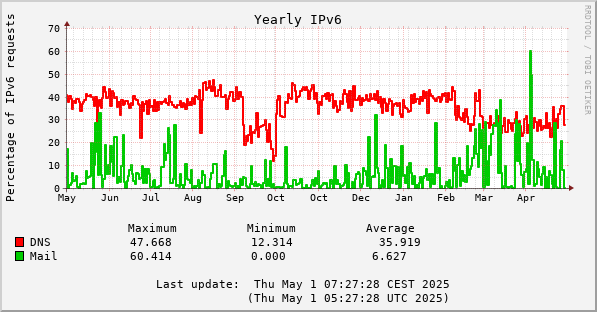
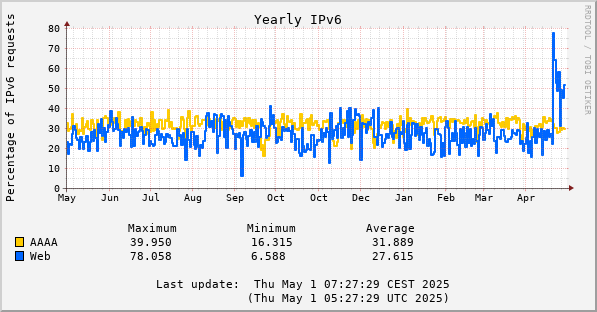
For destination ports 25 (mail), 53 (DNS) and 80 (web).
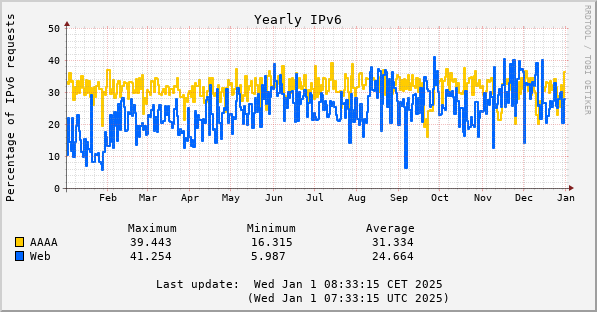
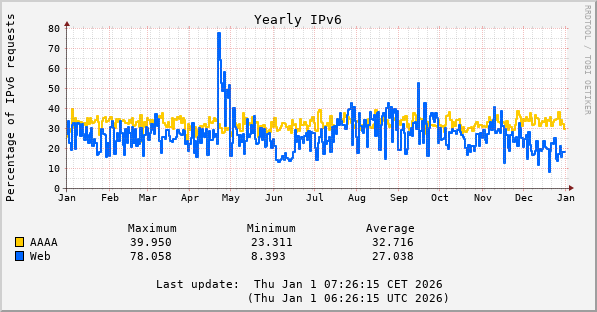
And;


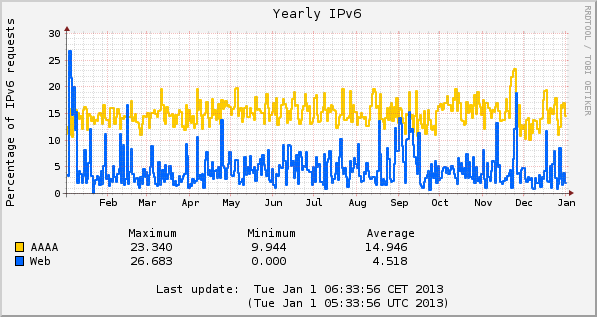
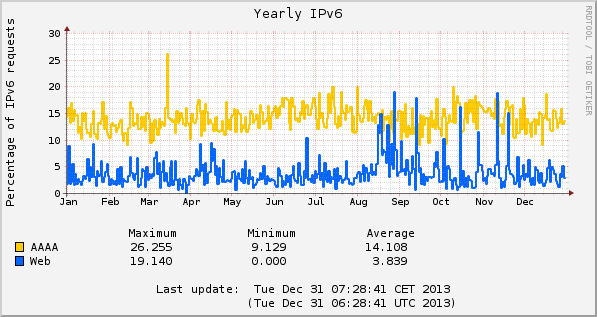
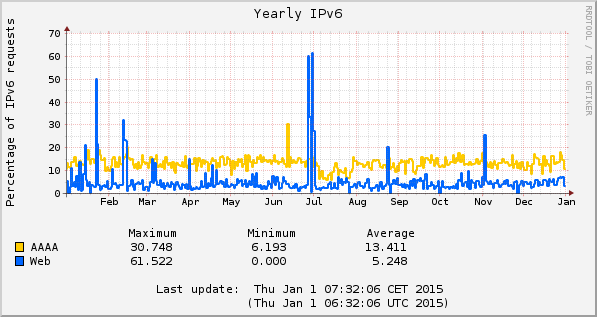
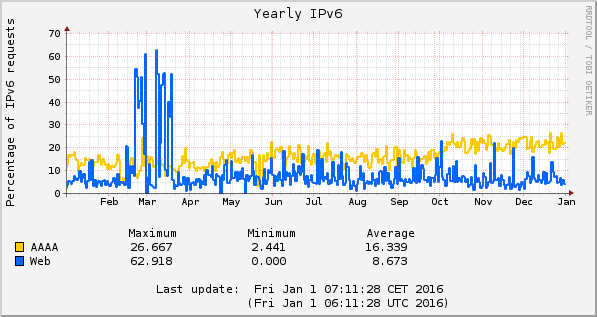
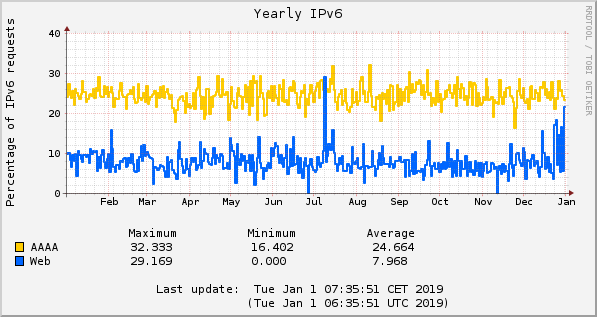
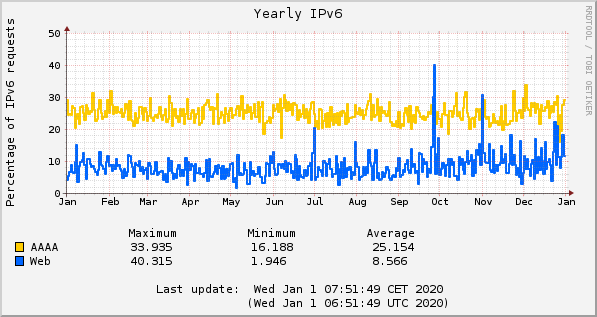
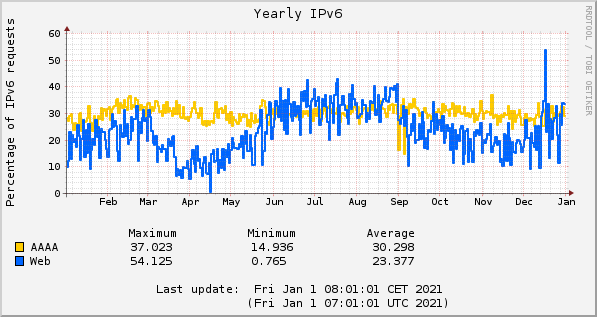
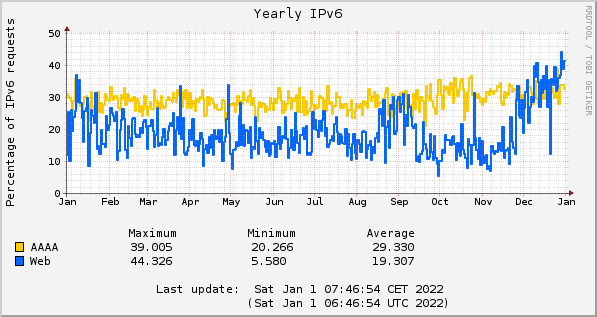
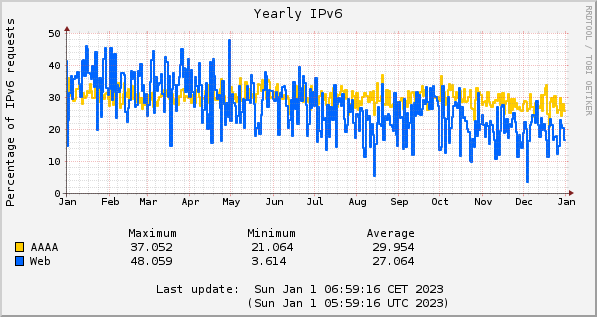
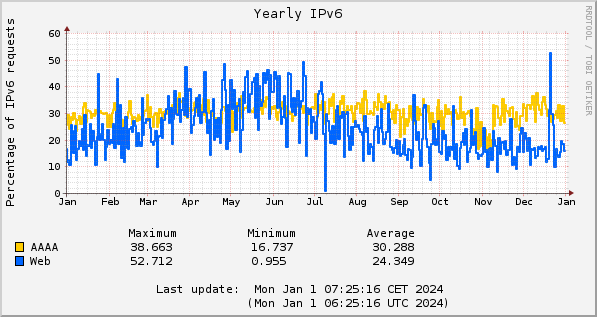
     www.sput.nl AAAA queries
  ------------------------------ x 100 %
   www.sput.nl A + AAAA queries

These are not necessarily from IPv6 source addresses.

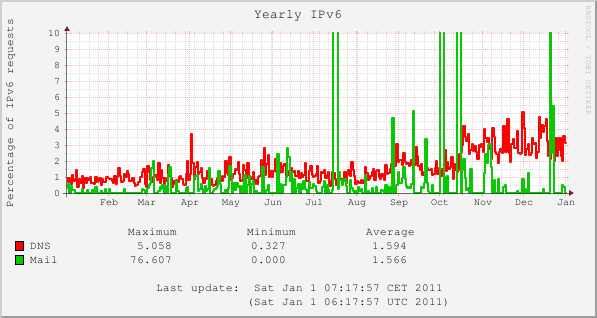
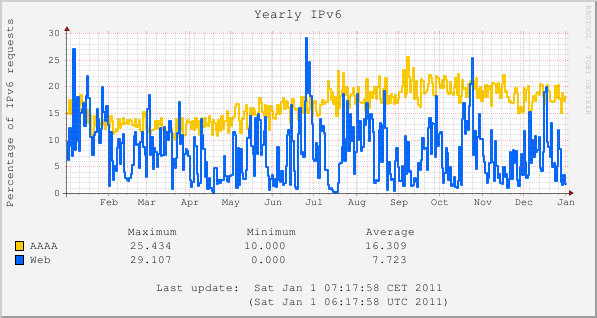
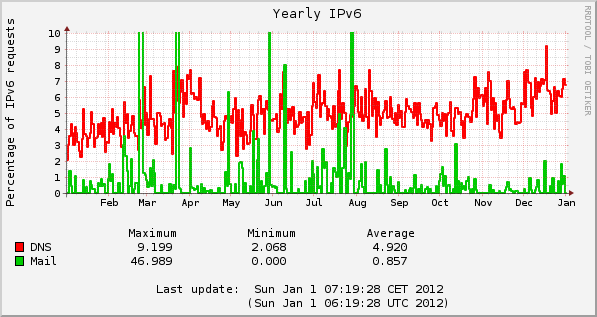
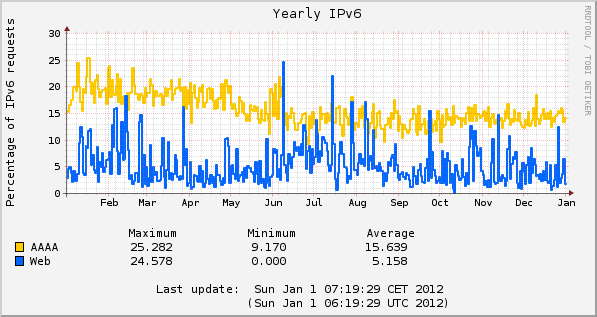
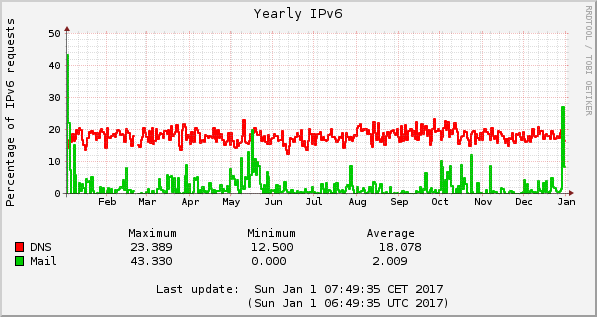
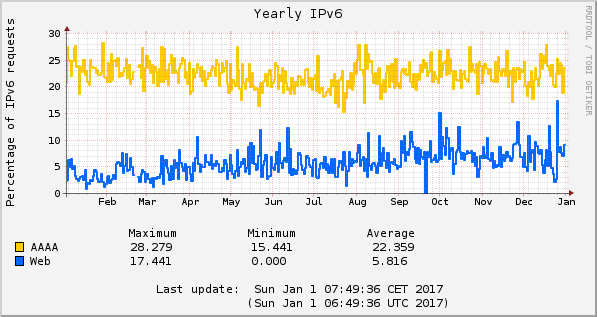
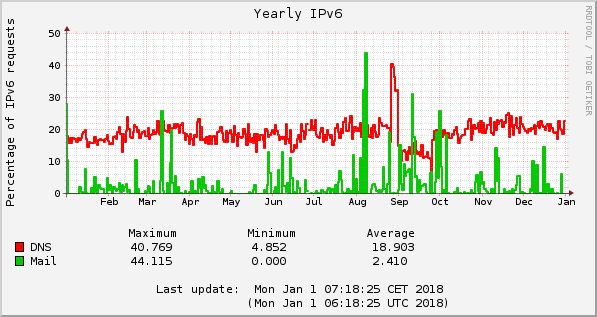
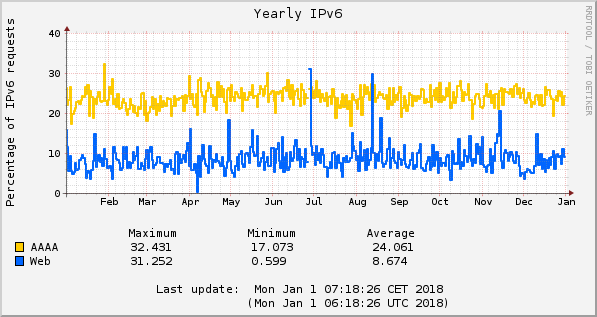
This is then plotted in the following graphs;

2010

2010 IPv6 DNS and mail percentages 2010 IPv6 web percentage

The large green spikes are spam attempts and limited to 10%.
The increase in DNS traffic in October corresponds with free IPv4 falling below 5 %.

2011

2011 IPv6 DNS and mail percentages 2011 IPv6 web percentage

2012

2012 IPv6 DNS and mail percentages 2012 AAAA and IPV6 web percentages

2013

2013 IPv6 DNS and mail percentages 2013 AAAA and IPV6 web percentages

2014

2014 IPv6 DNS and mail percentages 2014 AAAA and IPV6 web percentages

2015

2015 IPv6 DNS and mail percentages 2015 AAAA and IPV6 web percentages

2016

2016 IPv6 DNS and mail percentages 2016 AAAA and IPV6 web percentages

2017

2017 IPv6 DNS and mail percentages 2017 AAAA and IPV6 web percentages

2018

2018 IPv6 DNS and mail percentages 2018 AAAA and IPV6 web percentages

2019

2019 IPv6 DNS and mail percentages 2019 AAAA and IPV6 web percentages

2020

2020 IPv6 DNS and mail percentages 2020 AAAA and IPV6 web percentages

2021

2021 IPv6 DNS and mail percentages 2021 AAAA and IPV6 web percentages

2022

2022 IPv6 DNS and mail percentages 2022 AAAA and IPV6 web percentages

2023

2023 IPv6 DNS and mail percentages 2023 AAAA and IPV6 web percentages

2024

2023 IPv6 DNS and mail percentages 2023 AAAA and IPV6 web percentages

Each entry runs from 00:00:00 to 23:59:59 local time.
RRDtool is made to believe that the update takes place just after 00:00:00 UTC. It likes it that way.
Due to a RRDtool bug, during DST the graph will show a 2nd October (instead of November) when the '--x-grid' option is used.

The red and green graphs are an indication of ISPs IPv6 use (resolvers and mail servers).
The yellow and blue graphs are an indication of IPv6 use at home.