dB Tables
Just some lookup tables. More info on Decibel on Wikipedia.
dB
Relative amplitude and power; dB above or below '1';
| Ampl | Power | dB |
|---|---|---|
| 10.0 | 100 | 20 |
| 7.94 | 63.1 | 18 |
| 5.62 | 31.6 | 15 |
| 3.98 | 15.9 | 12 |
| 3.16 | 10.0 | 10 |
| 2.82 | 7.94 | 9 |
| 2.51 | 6.31 | 8 |
| 2.24 | 5.01 | 7 |
| 2.00 | 3.98 | 6 |
| 1.78 | 3.16 | 5 |
| 1.58 | 2.51 | 4 |
| 1.41 | 2.00 | 3 |
| 1.26 | 1.58 | 2 |
| 1.12 | 1.26 | 1 |
| 1.00 | 1.00 | 0 |
| 0.89 | 0.79 | -1 |
| 0.79 | 0.63 | -2 |
| 0.71 | 0.50 | -3 |
| 0.63 | 0.40 | -4 |
| 0.56 | 0.32 | -5 |
| 0.50 | 0.25 | -6 |
| 0.45 | 0.20 | -7 |
| 0.40 | 0.16 | -8 |
| 0.35 | 0.13 | -9 |
| 0.32 | 0.10 | -10 |
| 0.25 | 0.06 | -12 |
| 0.18 | 0.03 | -15 |
| 0.13 | 0.02 | -18 |
| 0.10 | 0.01 | -20 |
The numbers in the above table are relative numbers, not volts or
watts;
If you reduce the volume by 3 dB you do get about 71% of the previous
amplitude and 50% of the previous power.
dBs and camera stops
The relative amplitudes of the 3 dB steps (-6, -3, 0, ...) almost but
not quite correspond with camera
f-numbers;
F-numbers are (rounded) multiples of √2. 3 dB steps are close
approximations thereof;
| Stop | Ratio | dB |
|---|---|---|
| 22 | 16 √2 | 27.09 |
| 16 | 16 | 24.08 |
| 11 | 8 √2 | 21.07 |
| 8 | 8 | 18.06 |
| 5.6 | 4 √2 | 15.05 |
| 4 | 4 | 12.04 |
| 2.8 | 2 √2 | 9.03 |
| 2 | 2 | 6.02 |
| 1.4 | √2 | 3.01 |
| 1 | 1 | 0 |
| 0.7 | 1/√2 | ‒3.01 |
| 0.5 | 1/2 | ‒6.02 |
The difference between the two (3 vs 3.01 dB) is about 0.12%.
dBm
The table below is based on 0 dB is 1 mW in 600 Ω (744.59667 mV).
| dBm | mV |
|---|---|
| 0 | 775 |
| -1 | 690 |
| -2 | 615 |
| -3 | 548 |
| -4 | 489 |
| -5 | 436 |
| -6 | 388 |
| -7 | 346 |
| -8 | 308 |
| -9 | 275 |
| -10 | 245 |
| -11 | 218 |
| -12 | 195 |
| -13 | 173 |
| -14 | 155 |
| -15 | 138 |
| -18 | 97.5 |
| -20 | 77.5 |
The telephone audio signal level is -9 dBm or 275 mV.
DTMF
tones are -7 dBm or 346 mV.
Dial- and other tones are different in each country. Often used values are
-12 dBm for dial tones and -20 dBm for busy- and ring-back tones.
dB below clip level
The peek level in this table corresponds with 32767 (the largest possible value of a 16‑bit signed integer).
| Peek dB | Max val |
|---|---|
| 0 | 32767 |
| -1 | 29203 |
| -2 | 26027 |
| -3 | 23197 |
| -4 | 20674 |
| -5 | 18426 |
| -6 | 16422 |
| -7 | 14636 |
| -8 | 13044 |
| -9 | 11626 |
| -10 | 10361 |
| -11 | 9234 |
| -12 | 8230 |
| -13 | 7335 |
| -14 | 6537 |
| -15 | 5826 |
| -18 | 4125 |
| -20 | 3276 |
The dB values in the above table are accurate for a square wave only. For a pure sine wave the RMS dB values are 3 dB lower (3.01 dB to be exact).
| Sine RMS dB | Max val |
|---|---|
| -3 | 32767 |
| -4 | 29238 |
| -5 | 26058 |
| -6 | 23224 |
| -7 | 20699 |
| -8 | 18448 |
| -9 | 16441 |
| -10 | 14653 |
| -11 | 13060 |
| -12 | 11639 |
| -13 | 10374 |
| -14 | 9245 |
| -15 | 8240 |
| -16 | 7344 |
| -17 | 6545 |
| -18 | 5833 |
| -19 | 5199 |
| -20 | 4633 |
dBm and bits
On the Wikipedia page
Digital
milliwatt is a description of 1 kHz 0 dBm
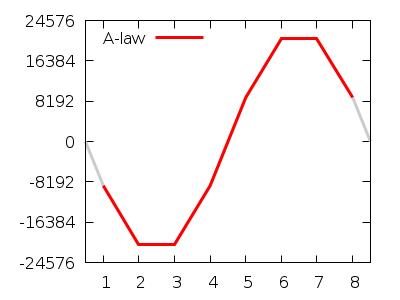
Alaw and µlaw test
signals. Below a translation to 16‑bit signed integers;
Of course, the actual analogue signal isn't this 'clunky'. Below a
more realistic signal;
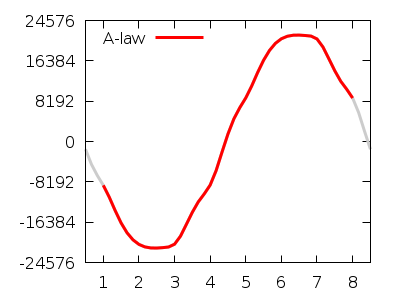
It's supposed to be a pure sine wave, but does in fact have some
3rd harmonic distortion.
Note that the 8‑bit values below are hex and the 16‑bit values decimal;
Alaw
| Degr | 8-bit | 16-bit |
|---|---|---|
| 202.5 | 34 | -8960 |
| 247.5 | 21 | -20992 |
| 292.5 | 21 | -20992 |
| 337.5 | 34 | -8960 |
| 22.5 | b4 | 8960 |
| 67.5 | a1 | 20992 |
| 112.5 | a1 | 20992 |
| 157.5 | b4 | 8960 |
Note: The highest value which a Alaw to
16‑bit conversion can produce is 32256 which is 0.14 dB (peek)
below 32767.
For a 500 Hz sine of the same amplitude the 0° to 180° values are;
| Degr | 16-bit |
|---|---|
| 0 | 8 |
| 22.5 | 8960 |
| 45 | 16128 |
| 67.5 | 20992 |
| 90 | 23040 |
| 112.5 | 20992 |
| 135 | 16128 |
| 157.5 | 8960 |
| 180 | 8 |
Note: There is no '0' in Alaw. It's either 8 or -8.
Note: This signal is 0.02 dB (RMS) stronger than the 1 kHz signal.
μlaw
| Degr | 8-bit | 16-bit |
|---|---|---|
| 202.5 | 1e | -8828 |
| 247.5 | 0b | -20860 |
| 292.5 | 0b | -20860 |
| 337.5 | 1e | -8828 |
| 22.5 | 9e | 8828 |
| 67.5 | 8b | 20860 |
| 112.5 | 8b | 20860 |
| 157.5 | 9e | 8828 |
Note: The highest value which a μlaw to
16‑bit conversion can produce is 32124 which is 0.17 dB (peek)
below 32767.
For a 500 Hz sine of the same amplitude the 0° to 180° values are;
| Degr | 16-bit |
|---|---|
| 0 | 0 |
| 22.5 | 8828 |
| 45 | 15996 |
| 67.5 | 20860 |
| 90 | 22908 |
| 112.5 | 20860 |
| 135 | 15996 |
| 157.5 | 8828 |
| 180 | 0 |
Note: This signal is 0.02 dB (RMS) stronger than the 1 kHz
signal.
Note: Some documents may mention a 14‑bit value of 5769 (or 5768) for
90° and 5329 for 67.5°; These correspond to 16‑bit values of 23076
(or 23072) and 21316;
If you encode a signal that is 0.5 * √2 of the maximum µlaw value,
you get 0.5 * √2 * 8158 ≈ 5768.577. Rounded
this is 5769 and rounded down 5768. This corresponds to 3.05 dB peek below
clip level.
However, if you convert these to µlaw and back you end up with 16-bit values
22908 and 20860.
dB Conversion table
For Alaw the 90° value is 23040, for μlaw 22908. These are 3.06 resp
3.11 dB below 32767.
So the peek level is about 3 dB below clip level.
Therefore the RMS value of a sine wave is about 6 dB below clip
level.
Note: As long as the signal doesn't clip, it's the RMS value that counts!
Below a litte conversion table;
| dB below clip level | dBm | |
|---|---|---|
| Peek | RMS | |
| 0 | -3 | 3 |
| -3 | -6 | 0 |
| -6 | -9 | -3 |
| -9 | -12 | -6 |
| -12 | -15 | -9 |
| -15 | -18 | -12 |
| -23 | -26 | -20 |
Note that the RMS values in this table apply to pure sinusoidal signals!
You can check the volume of a file with 'sox [File Format] File_Name -n stats';
~$ sox -t raw -r 8000 -e signed-integer -b 16 -c 1 File_Name.sln -n stats
DC offset   0.000010
Min level  -0.462158
Max level   0.505310
Pk lev dB      -5.93
RMS lev dB    -27.92
RMS Pk dB     -14.87
RMS Tr dB     -90.69
Crest factor   12.58
Flat factor     0.00
Pk count           2
Bit-depth      15/16
Num samples    2.86M
Length s     357.440
Scale max   1.000000
Window s       0.050
Note that the '-n stats' bit goes after the file name!
The 'RMS Pk dB' of -14.87 corresponds with approximately -9 dBm.